I know this feels like a great achievement! Getting the chance to see the model that you have been working on for the last couple of weeks scoring such high accuracy on the test set, is one of the most rewarding moments that you can ever live. Trust me, I know the feeling.
But as glorious as it sounds, I really hate to break it up for you by saying that what you achieved might not lead anywhere… Not because it is not good, but because it might not be enough!

Do you mean that you want 100% accuracy?!!!
No no, definitely not that 😛 Definitely I don’t mean achieving 100% accuracy, because that might be even worse!
No no, definitely not that 😛 Definitely I don’t mean achieving 100% accuracy, because that might be even worse!

What are you saying, dude?!
Ok I know you’re not convinced with what I am saying, so let me take a moment here to explain myself.
Ok I know you’re not convinced with what I am saying, so let me take a moment here to explain myself.

Suppose you are building a classifier that detects whether an email is Spam or Not Spam… What’s gonna be your classifier in this case? Simply put, your classifier will be like a function that you call … You give it an email as input, and it gives you back an output that informs you whether the provided email is spam “1” or not spam “0”.

So far so good … Next?
Now suppose that the model you have gives an output of “0” whatever was the input provided: so no matter which email you provide, the model will tell you that it is not spam… What would you say about such a model?
Well that’s a stupid model! How dare you compare it to mine? Man, I’m telling you I have 99.99% accuracy!
Please bear with me, I’m not comparing, I’m just trying to explain things step by step. Now although you and I know that this model is stupid, let us try to assess it by numbers! So let’s try to compute its accuracy per se.
Ok, I’m in! I’m just willing to see what’s your end goal Fouad!
Ok, thanks 😄 Let’s start! To assess any model in general, we need to give it an input and then compare what the model predicts with the real output. So in our case, we need to give our model some emails that we already know if they are spam or not, and then compare the ground truths with the decisions of our model. Now let’s say that we tested the model on 10 emails and let’s assume that 9 out of these emails are not spam. What do you think would be the accuracy of the model?
Man what is the matter with you?! I told you from the beginning, it’s NOT gonna be good!
I know I know … but … let’s calculate the accuracy, shall we? Given that our model will only predict “0”, all of the 10 predictions will be “0”. And given that 9 out of the 10 emails that we provided are not spam, this would mean that 9 of the emails should be labeled as “0” and only one email should be labeled as “1”.
Wait a minute … Does this mean that …
Yes, there you go… This useless model that we talked about was able to get 9 correct answers out of 10, which means it has 90% accuracy… So as you might have guessed, accuracy is not everything …

So, to evaluate a classifier, we’re not only interested in how much accurate it is … We need to assess where it is failing and where it is doing good, and the most intuitive way to see these is through …
The Confusion Matrix
The confusion matrix will tell you how well your model is predicting each of the classes that you have. Let’s go back to spam detection, and suppose that the data that we tested the classifier on was about 200 samples out of which 150 are Spam and 50 are not spam. Now for these 200 samples, the classifier can predict Spam or not Spam regardless of what the true labels are. So let’s say that out of the 150 Spam emails, the model was able to detect 120 as spam but failed to detect the other 30, and out of the 50 non-spam emails, the model was able to correctly identify 40 as non-spam but got tricked by the other 10 and considered them as spam. We can represent these predictions via a matrix that you can see below.
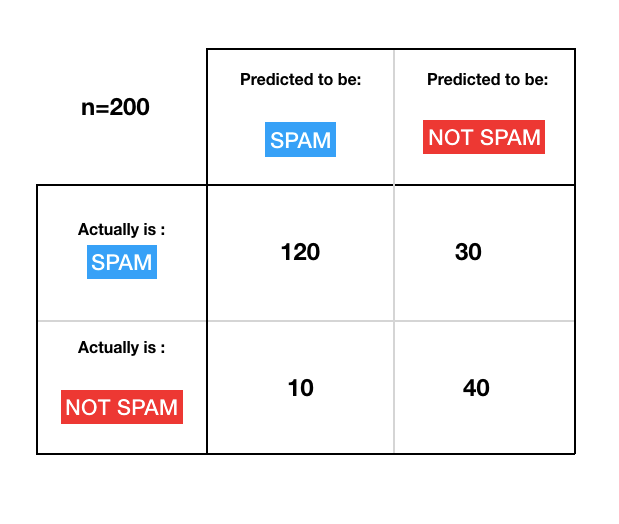
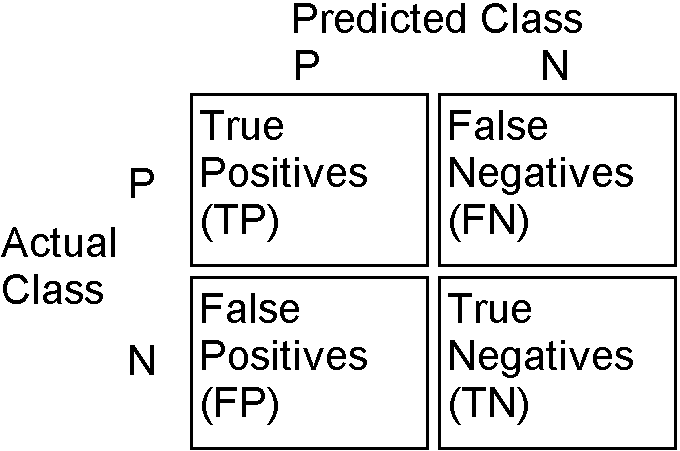
Let’s understand what’s inside of this confusion matrix to appreciate its importance.
- When the model predicted Spam and the email was “spam”, it means that the model predicted a “Positive”, and this positive was True, so we say that the model predicted a True Positive (TP).
- When the model predicted Spam but the email was “not spam”, it means that the model predicted a “Positive”, but this positive was False, so we say that the model predicted a False Positive (FP).
- When the model predicted Not Spam but the email was “spam”, it means that the model predicted a “Negative”, but this negative was False, so we say that the model predicted a False Negative (FN).
- When the model predicted Not Spam and the email was “not spam”, it means that the model predicted a “Negative”, and this negative was True, so we say that the model predicted a True Negative (TN).
The 4 metrics we discussed are the essence of the confusion matrix and they tell us not only how many total correct predictions we obtained, but how many correct predictions we have per class, and this is very essential while evaluating any classifier.
From the explanation above we can say that the model we had in the example achieved the following results:
- TP = 120
- FP = 10
- FN = 30
- TN = 40
I hope by now you see the importance of a confusion matrix because it literally tells you everything you want to know about your model’s performance. Not only that, but you can use the values of a confusion matrix to derive important metrics that can help you better assess how well your model is doing. Next, we will discuss the most common 4 of them.
1. Accuracy
Although accuracy alone might not give you the full picture, definitely you need to compute it to see how accurate is your model. Accuracy mainly answers the following question:
Out of all the predictions that the model has made, how many were actually correct?
To do this, you simply divide the number of times where your model predicted something right (TP+TN) by the total number of predictions your model has made (TP+TN+FP+FN), so the formula becomes as follows.
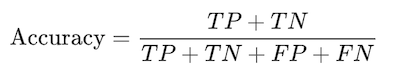
In the model described above, the accuracy is given by:
(120+40)/(120+30+10+40)=80%
2. Precision
Precision is another metric you might want to take a look at. Precision mainly answers the following question:
Out of the positive predictions that the model has made, how many were actually correct?
To do this, you simply divide the positives that your model correctly predicted (TP) by all the positives that your model predicted (TP+FP), so the formula becomes as follows:
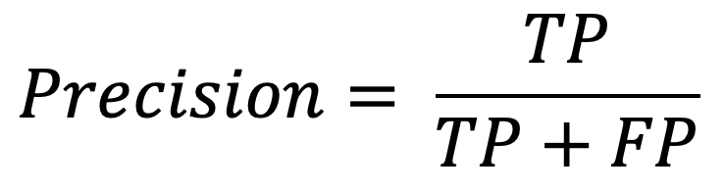
In the model described above, the precision is given by:
120/(120+10)=92.31%
3. Recall
And here’s another important metric to look at when evaluating your classifier: Recall. This metric mainly answers the following question:
Out of the actual positive samples, how many was my model able to identify correctly?
To do this, you simply need to divide the positives that your model correctly predicted (TP) by all the actual positives (TP+FN), so the formula becomes as follows:
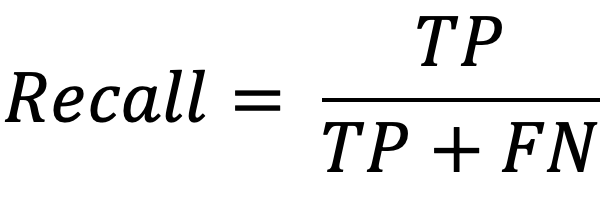
In the model described above, the recall is given by:
120/(120+30)=80%

Ok great, but what does it really mean when you report a certain precision or a certain recall? So what’s their significance I mean?
Great Question! Here’s a short answer that tells you everything.
Precision means: if your model predicted positive, how much are we sure that the prediction is correct.
Recall means: if the sample provided is positive, how much your model is expected to detect it.

There is kind of an inverse relationship between precision and recall: when one goes up the other will likely go down (up to certain limits of course), and looking at both metrics is substantial for evaluation. For this reason, we introduce another metric that takes them both into consideration.
4. The F1-Score
The F1-Score is a metric that combines both precision and recall, and once your model’s F1-Score is high, it means that most likely the precision and the recall are high as well. The F1-Score’s formula is given by:
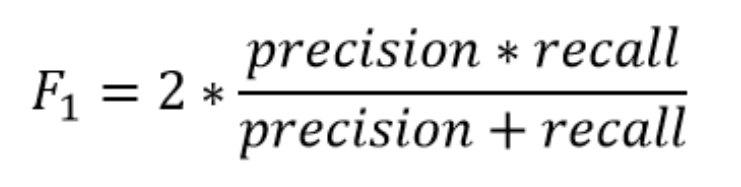
So the F1-Score of the model described above is 85.71%.
And that’s pretty much it …
I hope I was able to make it clearer for you. The main idea that you should get out of this blog is that accuracy — even though it’s the most intuitive metric — does not give you the full picture of how your model is performing. For this reason, there are other metrics that can give you better intuition and lets you assess your model with respect to each individual class. These metrics are very much essential to prove whether a model is doing well or not…