This image was created using the DALL·E model. It does not depict a real person.
In a world where AI tools are advancing rapidly and becoming more widespread, barely a week goes by without a new trend lighting up social media. The latest craze? Turning your selfies into illustrations inspired by the iconic style of Studio Ghibli — the famed Japanese animation studio behind beloved films like Spirited Away and My Neighbor Totoro. With just one click, you can see yourself transformed into the hero of a whimsical anime world.
But like most digital trends, there’s always more happening behind the scenes.
Imagine a tool that can predict the likelihood of tooth loss based on a patient’s clinical data. Such a tool could inform treatment plans, minimize complications, and enhance patient outcomes. By analyzing features such as age, sex, periodontal status, and active therapy history, our model identifies patterns that often go unnoticed in traditional evaluations.
Periodontitis is a multifaceted gum disease caused by bacteria and the body’s response to them, which, if left untreated, can result in tissue and tooth loss. Traditional treatments often involve cleaning techniques and, in some cases, surgery to manage the condition. However, determining the most effective treatment can be difficult due to the significant variations in how periodontitis develops among individuals, influenced by unique risk factors and disease progression. Artificial intelligence (AI) offers a revolutionary approach by analyzing patient-specific data—such as x-rays and gum health indicators—to predict the most suitable treatment. Unlike conventional trial-and-error methods, AI-driven solutions enable dentists to make more precise decisions, enhancing outcomes and reducing the risk of tooth loss. A new study is focused on developing an AI tool designed to guide personalized treatment plans, redefining the management of periodontitis and ensuring patients receive care tailored to their specific needs.
Predicting tooth loss involves navigating complex variables, including systemic diseases, initial dental conditions, and therapy outcomes. The main obstacle include:
To overcome this challenges, our approach integrated data preprocessing, feature engineering as well as applying an oversampling technique that is called SMOTEEN, along with different models training and model optimization techniques tailored for medical datasets.
Data Processing
Random Oversampling: Addressed class imbalance by increasing the minority class instances, ensuring the model learned patterns effectively. We used SMOTE technique (Synthetic Minority Oversampling Technique) to have AI generated synthetic data to solve this problem.
Label Encoding: Converted categorical features like Sex and Periodontal Disease into numerical formats suitable for machine learning algorithms. Some of them were mapped, for example Male: 0 and Female: 1 while others were done by one hot encoding using LabelEncoder.
Machine Learning Models
The model was trained using:
17 Features: including age, Sex, Initial No. of Teeth, Tooth number, PPD, Active Therapy and others.
Target: Binary classification of Tooth Loss (Yes/No).
Deployment Framework
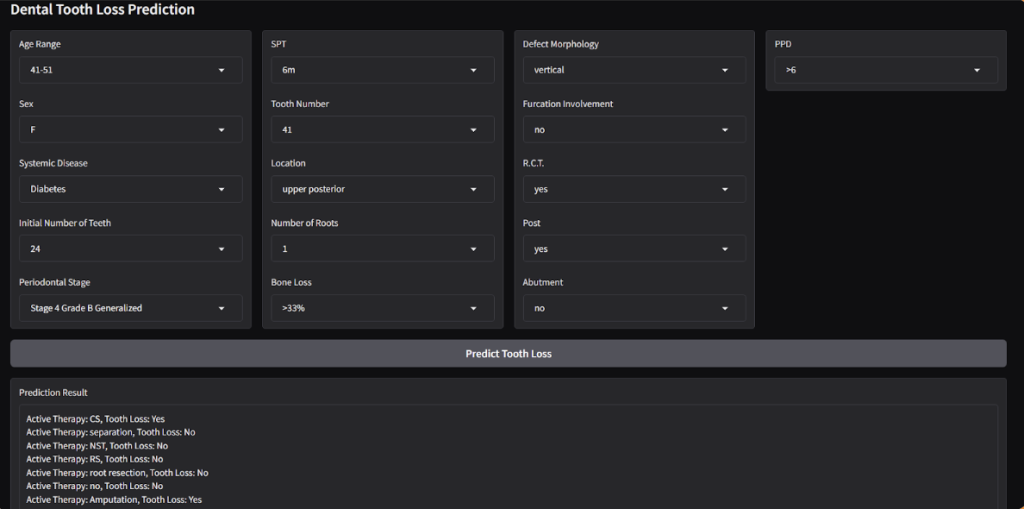
Using Gradio, the project offers an interactive interface for users to input patient details, instantly receiving predictions. Gradio bridges the gap between complex machine learning models and user-friendly interfaces.
Methodology
Step 1: Data Cleaning and Preprocessing
The raw dataset included categorical and numerical variables, necessitating extensive preprocessing, some processing included:
Missing values were addressed to maintain dataset integrity.
EDA (Exploratory Data Analysis): Matching values that look different but are the same as “Upper Posterior” and “Posterior Upper”
Standardize some features such as those that have different uppercase letters such as “vertical” and “Vertical”, those values are very sensitive to the model and may consider them different, so they need to be addressed.
Categorical features were encoded into numerical using different methods such as mapping and one-hot encoding.
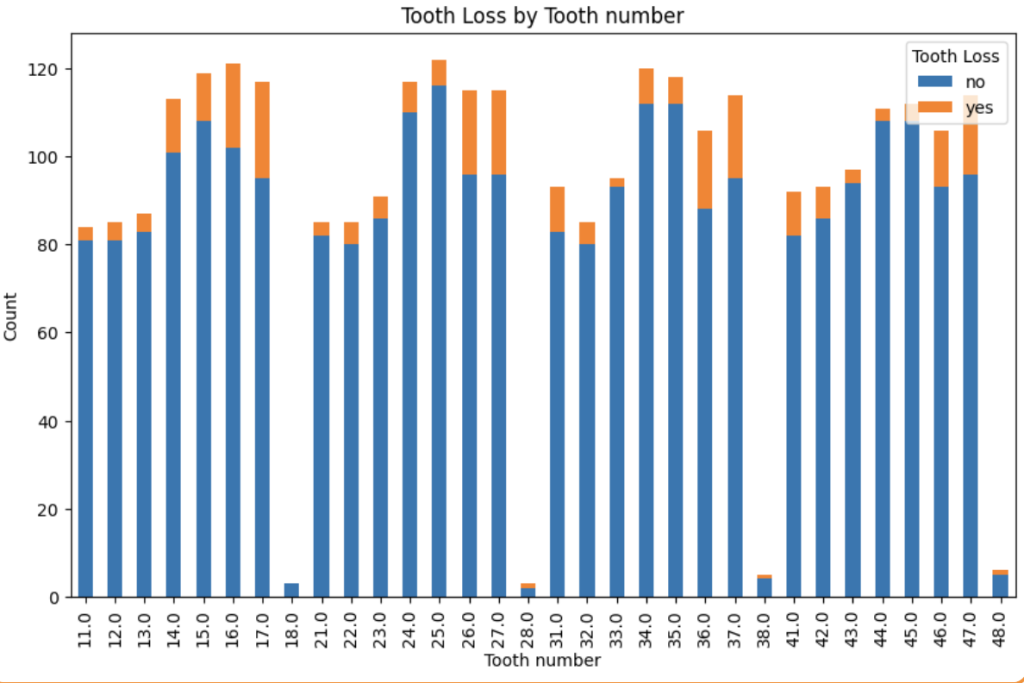
Checking the correlation between each feature and the target column “Tooth loss” by relying on different metrics, for example. The categorical data were checked using Chi-square value; after computing the Chi-square value, it is compared to a Chi-square distribution table using the degrees of freedom to determine the p-value. If the p-value is below a certain threshold (e.g., 0.05), the result is considered statistically significant. The following image is one of the results, showing the distribution of tooth loss along the bone loss %.
After splitting our dataset between 20-80% for testing and training data, we applied SMOTE as mentioned before and started exploring various machine learning algorithms. At first we did decrease the threshold of Y output (prediction), but with further analysis we saw that increasing this threshold will result in better results for all the models, so we set the threshold to 0.7, we did hyperparameters tuning for each model, optimizing for accuracy and interpretability. Key steps included:
Confusion Matrix:
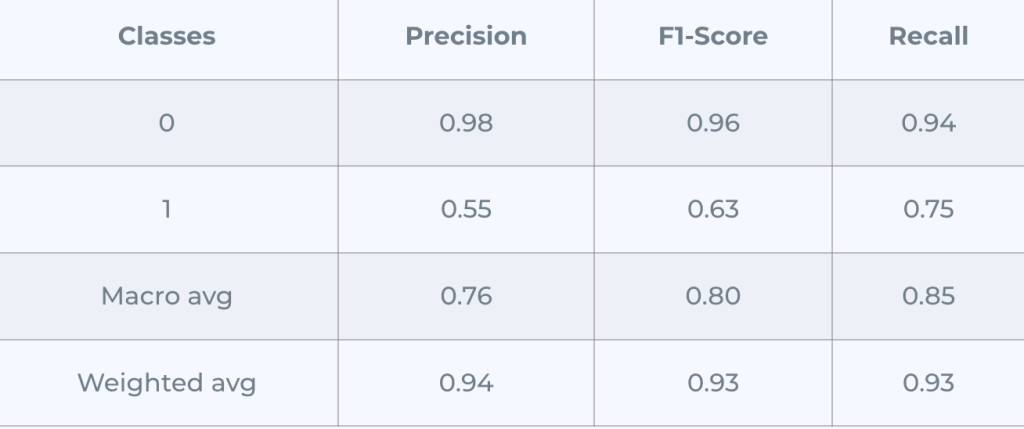
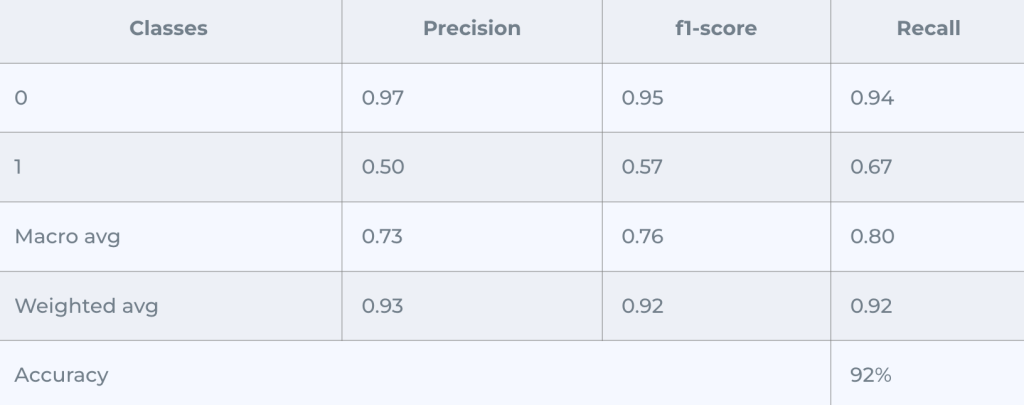
The matrix at the beginning indicates the confusion matrix of the model, in other words, how well the model is predicting the class rightly, as we can see we have 488 samples that belong to the first class correctly and 38 belongs to the second class correctly, while the model misclassified 50 and 10 for both classes.
Note: the classes here are yes/no for tooth loss.
This was the best result we could get out of all the models we used, the confusion matrix is at its best.
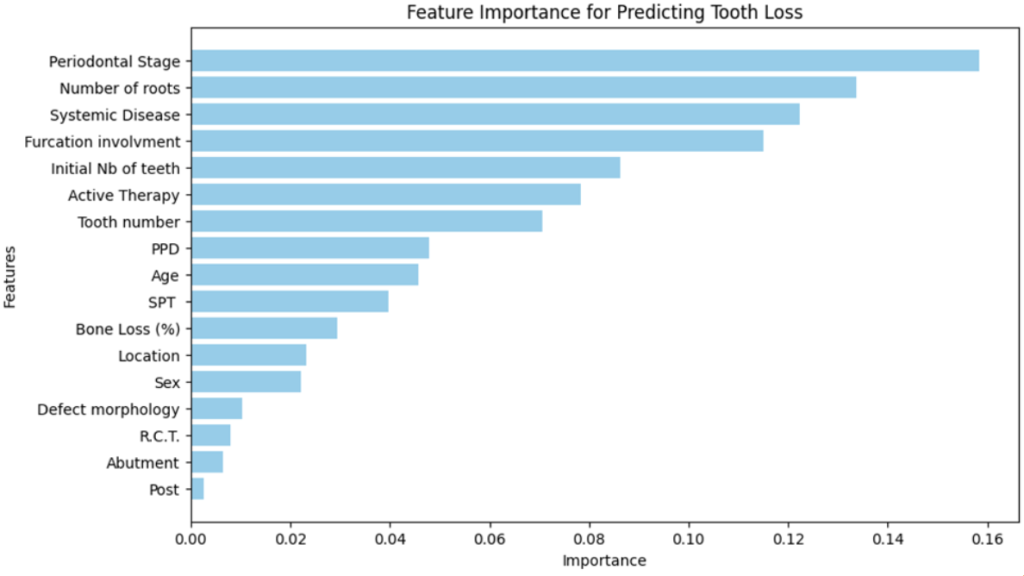
The feature importance chart:
2. Lightgbm: similar to RandomForest but with different architecture, we followed the same procedure, the following results belong to the optimization stage:
Confusion Matrix (Adjusted Threshold):
AUC Score = 0.9108
It performed good enough for the first class of misclassifying 32 samples, but for the second class we got 16 misclassified, which was better in Random Forest Model
The feature importance chart:
3.XGBoost
After the hyperparameters tuning and increasing the threshold, we got the following result:
Confusion Matrix (Adjusted Threshold):
4. Deep learning model: we explored creating a deep learning model from scratch with 5 hidden layers with each containing different numbers of neurons, and activation function, while we assigned a sigmoid activation function for the output layer because it is binary classification. The model was trained on 50 epochs, it performed well for a primitive model but not better than the first two, the following image contains the results:
Confusion Matrix:
5. Ensemble Stacking: it is a powerful machine learning technique that combines predictions from multiple models (referred to as “base models”) to produce a final prediction, improving overall accuracy and robustness. The base models were random forest, XGBoost, LightGBM, we also assigned the meta model to be the logistic regression to aggregate the predictions from the base models and output the final result.
It was complex enough not to perform the best, even after increasing the threshold we got this:
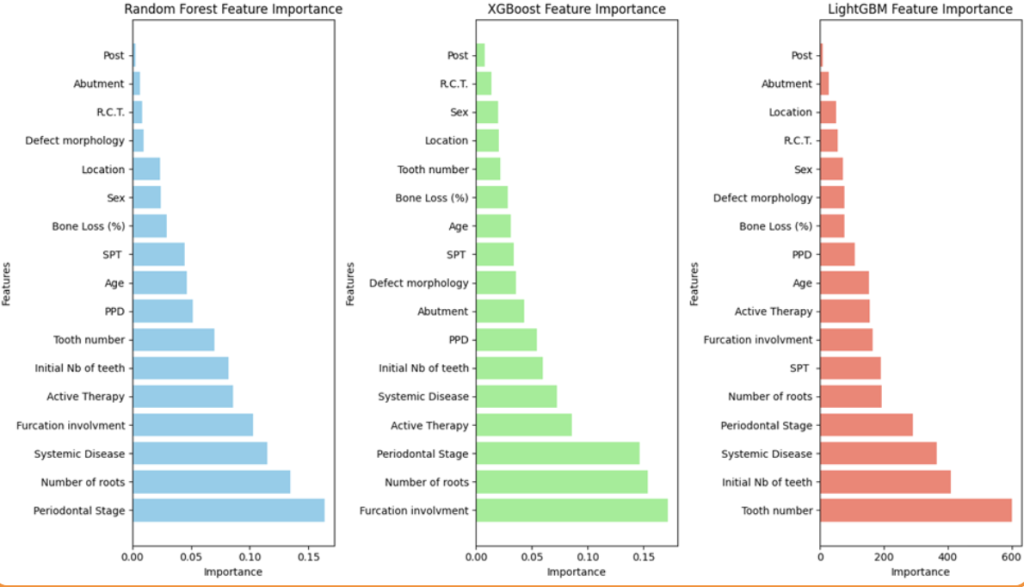
All in all, the random forest model achieved the best results.
Step 3: User-Centric Interface
Designed with end-users in mind, the Gradio interface simplifies data entry and interpretation:
Since we want to make it iterative for each active therapy to take the decision of what therapy has the minimalist effect, we managed to show the UI as follows:
The model achieved promising results in predicting tooth loss:
This project demonstrates the potential of AI in revolutionizing dental care. By predicting tooth loss proactively, we can shift the focus from treatment to prevention, saving time, costs, and patient discomfort.
Future developments could integrate real-time patient data via IoT devices or expand predictions to include other dental outcomes. As we continue refining our tools, the vision of personalized, predictive dental care becomes increasingly achievable.